
👋 Hi, I’m Ameerah
Always learning, always becoming.
About Me ✨
Welcome to my data portfolio!
I’m a Statistics graduate with a specialization in Big Data Analytics, passionate about turning raw data into meaningful narratives. Whether it’s modeling inflation trends, exploring public sentiment, or visualizing patterns in music and crime, I enjoy solving real-world problems through data.
I’m especially drawn to:
- 📊 Data storytelling that brings insights to life
- 🧠 Statistical modeling for forecasts and decisions
- 💡 Process improvement powered by evidence
- 🔎 Exploring the human side of data through sentiment & behavioral analysis
I have a growing interest in data science, particularly in applying machine learning to understand complex systems and drive better decisions. I’m constantly exploring new tools and techniques to deepen my skillset.
My current toolkit includes R, Python, SQL, Power BI, and Markdown/HTML. I believe in clean visuals, reproducible work, and making data accessible to all.
Featured Projects 📈📊🤖
📺 YouTube Global Statistics Report
What drives subscriber growth on the world’s biggest platform?
Click to expand/collapse project details
An interactive R Markdown analysis exploring patterns in subscriber count, content category, and geography — powered by bootstrap regression and statistical testing.
📌 Featured Visual:
Highlights:
- 🎶 Entertainment and Music lead in both views and subscribers.
- 📉 More uploads ≠ more subscribers — the relationship is weak and nonlinear.
- 🌍 U.S. and India dominate the top channel landscape.
🔗 View GitHub Repo 📄 Read the Report on RPubs
🚨 Boston Public Safety Dashboard
How can public crime data reveal safer paths forward?
Click to expand/collapse project details
An interactive dashboard project analyzing over 50,000 Boston crime records using Power BI and Excel. Focused on uncovering crime hotspots, temporal patterns, and offense trends to support public safety decisions.
📌 Featured Visual:
Highlights:
- 🕓 Crimes are most frequent between 10 AM – 10 PM, peaking around 4 PM.
- 🔍 Common offenses include larceny, assault, and drug violations.
- 🗺️ Maps and filters help identify high-risk neighborhoods and time zones.
🎧 Spotify Streaming Analysis 2024
Can streaming features help predict whether a song is explicit?
Click to expand/collapse project details
This project analyzes Spotify’s 2024 streaming data to classify tracks as explicit or not. The analysis involved data cleaning, EDA, and applying supervised learning models — all performed in Python.
📌 Featured Visual:
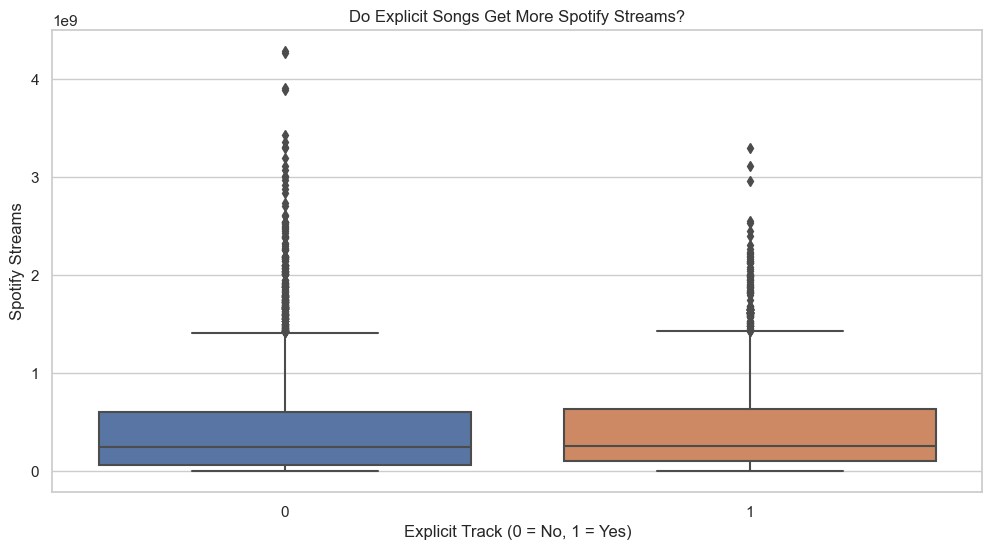
Highlights:
- ⚖️ Addressed class imbalance using Balanced Random Forest and baseline Logistic Regression.
- 📊 Included ROC curve evaluation and comparison between models.
- 🧹 Comprehensive preprocessing and EDA to understand feature distributions.
📈 CPI Forecasting with ARIMA (Python)
How can past inflation data help us predict future trends?
Click to expand/collapse project details
An end-to-end time series modeling project using manual ARIMA tuning and backward stepwise regression to forecast Malaysia’s Consumer Price Index (CPI). The final model was evaluated against actual CPI values from Sep 2023–Aug 2024.
📌 Featured Visual:
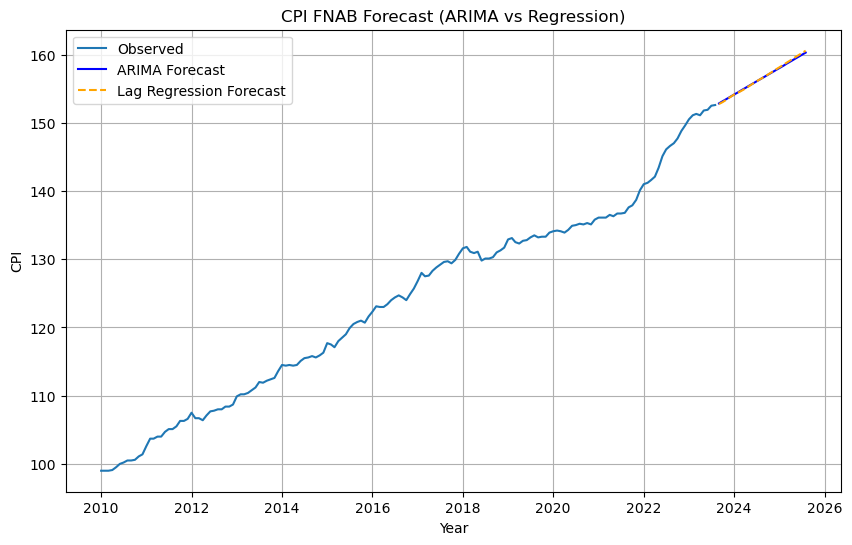
Highlights:
- 🔍 Built ARIMA(1,1,2) model manually with statistical testing (ADF, KPSS).
- 📉 Included backward stepwise regression with lag features to optimize prediction.
- 📊 Compared forecast results against actual CPI for accuracy assessment.
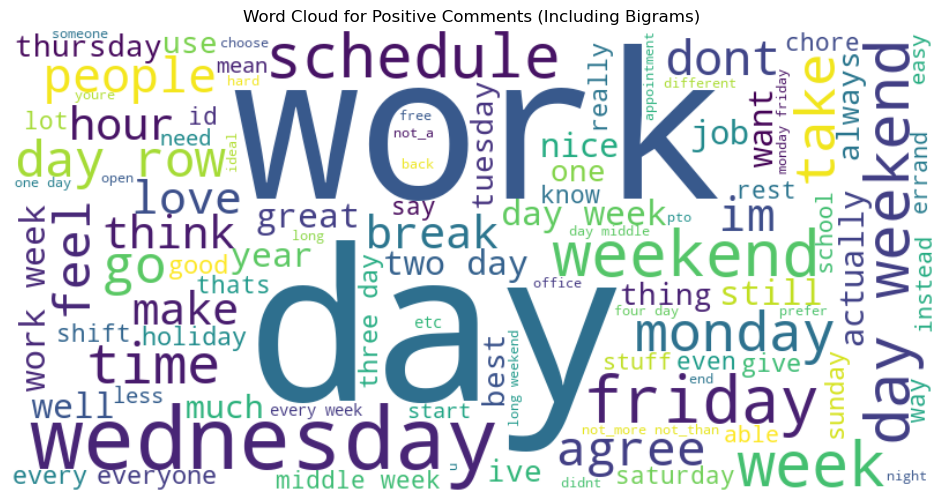
💬 Reddit Sentiment Analysis: Hump Day Yay or Nay?
Should Wednesdays be the new weekend?
Click to expand/collapse project details
A lighthearted NLP project exploring Reddit sentiment toward a midweek break. Using over 1,100 comments from a viral post on r/unpopularopinion, the analysis combines scraping, sentiment scoring, and quirky word clouds to uncover what the internet really thinks of #MidweekReset.
📌 Featured Visual:
Highlights:
- 🧼 Full NLP pipeline: text cleaning, tokenizing, stopword removal.
- 🧠 VADER sentiment scoring with negation-aware processing.
- 📊 Violin plots and word clouds reveal emotional tones and common themes.
- 🔍 Top-voted comments skewed positive or neutral, supporting midweek reset.
⚾ MLB SQL Analysis
Exploring player performance with window functions and CTEs
Click to expand/collapse project details
A structured SQL and Tableau project analyzing Major League Baseball (MLB) player data from Maven Analytics. The SQL portion focuses on player origins, salaries, and career spans using CTEs, window functions, and aggregation techniques. Tableau brings the findings to life through interactive visuals.
📌 Featured Visual:
Highlights:
- 🧮 Applied
ROW_NUMBER,NTILE, andLAGto analyze debut/final games and career lengths. - 🏫 Identified top schools producing high-earning, long-career MLB players.
- 💸 Explored team salary distributions and milestone thresholds ($1B+ in salary spend).
- 📊 Built a Tableau dashboard featuring:
- Treemap of top 10 salary-producing schools
- Funnel from schools to $5M+ players
- Scatter plot of career span vs. school salary
- Choropleth map of player origins by state
- Bar chart of top schools by career longevity
Reach Me 📧
☕ Thank You
Appreciate you stopping by!
Whether it’s building models or making sense of meme sentiment, I love bringing data to life — usually with a strong coffee in hand.
Let’s chat if you’re into dashboards, storytelling, or data that makes you go “huh, interesting.”
Chasing patterns, questions, and great coffee,
— Ameerah